Hospitality
Hotel Revenue Management
Hospitality revenue management teams play a crucial role in maximizing a hotel group's profitability through strategic pricing and inventory control. They leverage booking curves and occupancy forecasts to optimize revenue per available room (RevPAR).
Let's take a look at how the Chronulus SDK can be utilized to estimate booking curves and occupancy based on contextual information.
Booking Curve
Import Packages
# python imports
from typing import List
from pydantic import BaseModel, Field
from datetime import datetime
from matplotlib import pyplot as plt

# chronulus sdk imports
from chronulus import Session
from chronulus.estimator import NormalizedForecaster
from chronulus_core.types.attribute import ImageFromUrl
Describe a Hypothetical Booking Curve Use Case
booking_curve_session = Session(
    name="Hotel Booking Curve",

    situation="""The Marriott Americas Revenue Management team is responsible
    for optimizing the revenue per available room at each of their locations
    across the United States.
    """,

    task="""
    Part of the rev-par optimization process requires the team to estimate the
    booking curve for a hotel ahead of each stay night. Forecast the booking
    curve for the hotel and stay-night provided.
    """,

    env=dict(
        CHRONULUS_API_KEY="<YOUR-CHRONULUS-API-KEY>",
    )
)
Define the HotelLocation data model
class HotelLocation(BaseModel):
    name: str = Field(description="The name of the hotel location")
    brand_umbrella: str = Field(description="The umbrella or brand name of the hotel")
    address: str = Field(description="The street address of the hotel location")
    stay_night: str = Field(description="The date of the stay-night we would like to forecast.")
    assumptions: str = Field(description="Any additional occupancy assumptions.")
    exterior_images: List[ImageFromUrl] = Field(default=[], description="A list of images of the exterior of the location")
Create a Booking Curve Agent
booking_curve_agent = NormalizedForecaster(
    session=booking_curve_session,
    input_type=HotelLocation,
)
NYE @ Midtown Manhattan
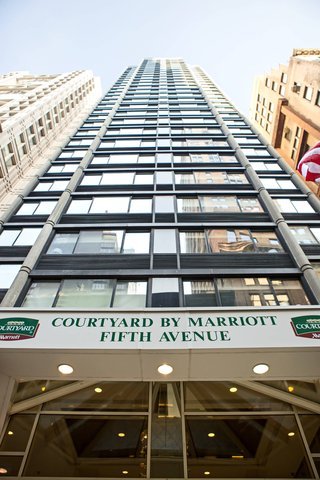
For this example, let's use the Courtyard location near Bryant Park in Midtown Manhattan.
# Fill in the metadata for the item or concept you want to predict
location = HotelLocation(
    name = "Courtyard New York Manhattan/Fifth Avenue",
    brand_umbrella = "Courtyard",
    address = "3 E 40th St, New York, NY 10016",
    stay_night = "2025-12-31",
    assumptions = "Assume all rooms are operational and able to be booked",
    exterior_images = [
        ImageFromUrl(url='https://s3-media0.fl.yelpcdn.com/bphoto/uj-Jm4GpYhOPItnp7zmhzg/o.jpg'),
    ]
)
We have included an image of the exterior of the hotel:

Booking Curve Prediction
# How far in advance we would like to start the curve
days_out = 180

# We'll choose the forecast horizon start date by counting backward from the stay-night in our location
forecast_start_date = datetime.strptime(location.stay_night, "%Y-%m-%d") - timedelta(days=days_out)

req = booking_curve_agent.queue(location, start_dt=forecast_start_date, days=days_out, note_length=(5, 7))
predictions = booking_curve_agent.get_predictions(req.request_id)
> predictions[0].to_pandas()

            y_hat
date
2025-07-04  0.152556
2025-07-05  0.154901
2025-07-06  0.157653
2025-07-07  0.159953
2025-07-08  0.162440
... ...
2025-12-26  0.999714
2025-12-27  0.999946
2025-12-28  1.000000
2025-12-29  0.999918
2025-12-30  1.000000

Explanation for Booking Curve
For this Courtyard property in Midtown Manhattan, I expect a strong booking curve leading up to New Year's Eve 2025. The hotel's prime location near Fifth Avenue and proximity to Times Square makes it highly desirable for the New Year's celebration. The booking pattern should show early corporate bookings (180 days out) followed by leisure travelers securing rooms for the holiday. I anticipate a steeper curve starting in October as availability becomes scarce. The curve will reflect typical seasonal patterns, with a slight dip in August-September before the holiday booking surge. Being a Courtyard brand in NYC, I expect a mix of business and leisure travelers, with leisure dominant for this particular stay date.
Occupancy
Describe a Hypothetical Booking Curve Use Case
occupancy_session = Session(
    name="Hotel Occupancy",

    situation="""
    The Marriott Americas Revenue Management team is responsible for optimizing
    the revenue per available room at each of their locations across the United
    States.
    """,

    task="""
    Part of the rev-par optimization process requires the team to forecast the
    occupancy (share of rooms booked) for a hotel location in advance given a
    specified discount from the base room rate. Forecast the occupancy for the
    given hotel location.
    """,

    env=dict(
        CHRONULUS_API_KEY="<YOUR-CHRONULUS-API-KEY>",
    )
)
Define a new HotelLocation data model with rate info
class HotelLocationWithRates(BaseModel):
    name: str = Field(description="The name of the hotel location")
    brand_umbrella: str = Field(description="The umbrella or brand name of the hotel")
    address: str = Field(description="The street address of the hotel location")
    assumptions: str = Field(description="Any additional occupancy assumptions.")
    exterior_images: List[ImageFromUrl] = Field(default=[], description="A list of images of the exterior of the location")
    base_rate: float = Field(description="The base rate for the room per night in USD")
    discount_schedule: str = Field(description="The schedule of discounts for this room")
Create a Occupancy Forecasting Agent
occupancy_agent = NormalizedForecaster(
    session=occupancy_session,
    input_type=HotelLocationWithRates,
)
Holiday Occupancy @ Midtown Manhattan
# Fill in the metadata for the item or concept you want to predict
location = HotelLocationWithRates(
    name = "Courtyard New York Manhattan/Fifth Avenue",
    brand_umbrella = "Courtyard",
    address = "3 E 40th St, New York, NY 10016",
    assumptions = "Assume all rooms are operational and able to be booked",
    exterior_images = [
        ImageFromUrl(url='https://s3-media0.fl.yelpcdn.com/bphoto/uj-Jm4GpYhOPItnp7zmhzg/o.jpg'),
    ],
    base_rate = 186.00,
    discount_schedule = "No discounts scheduled."
)
forecast_start_date = datetime(2025,12,1)

req = occupancy_agent.queue(location, start_dt=forecast_start_date, days=60, note_length=(5, 7))
predictions = occupancy_agent.get_predictions(req.request_id)
> predictions[0].to_pandas()

            y_hat
date
2025-12-01  0.825056
2025-12-02  0.785107
2025-12-03  0.795039
2025-12-04  0.815057
2025-12-05  0.835018
... ...
2026-01-25  0.835024
2026-01-26  0.785020
2026-01-27  0.794938
2026-01-28  0.804942
2026-01-29  0.814925

Explanation for the Occupancy Forecast
This Courtyard property's location in Midtown Manhattan near Fifth Avenue suggests strong business traveler occupancy during weekdays and tourist occupancy on weekends. The December-January period spans major holidays and events in NYC, including Christmas, New Year's, and winter shopping season. Given the prime location and moderate base rate of $186, I expect high occupancy throughout, with peaks around New Year's Eve and holiday shopping periods. The first two weeks of December should see strong business travel, followed by a slight dip mid-month, then rising sharply for holiday tourists. Early January typically sees lower occupancy due to post-holiday slowdown, gradually increasing as business travel resumes mid-month. Weekend occupancy rates will generally be higher than weekdays during the holiday season, reversing the typical pattern for this location.