Transportation
Project Feasibility Study and Analysis
Import Packages
# python imports
from typing import List
from pydantic import BaseModel, Field
from datetime import datetime
from matplotlib import pyplot as plt

# chronulus sdk imports
from chronulus import Session
from chronulus.estimator import NormalizedForecaster
from chronulus_core.types.attribute import ImageFromUrl
Describe the Foot Traffic Prediction Use Case
For a description of the Interborough Express Project, we use publicly available information provided on the project by NYC MTA.
Let's set the goal of predicting foot traffic between the IBX and an existing subway line. None of these connection points exist yet, but that shouldn't stop us from estimating what the foot traffic might look like.
chronulus_session = Session(
    name="NYC Interborough Express Feasibility Study",

   situation="""The Interborough Express (IBX) is a transformative rapid transit
    project that will connect currently underserved areas of Brooklyn and Queens.
    It will substantially cut down on travel times between the two boroughs,
    reduce congestion, and expand economic opportunities for the people who live
    and work in the surrounding neighborhoods.

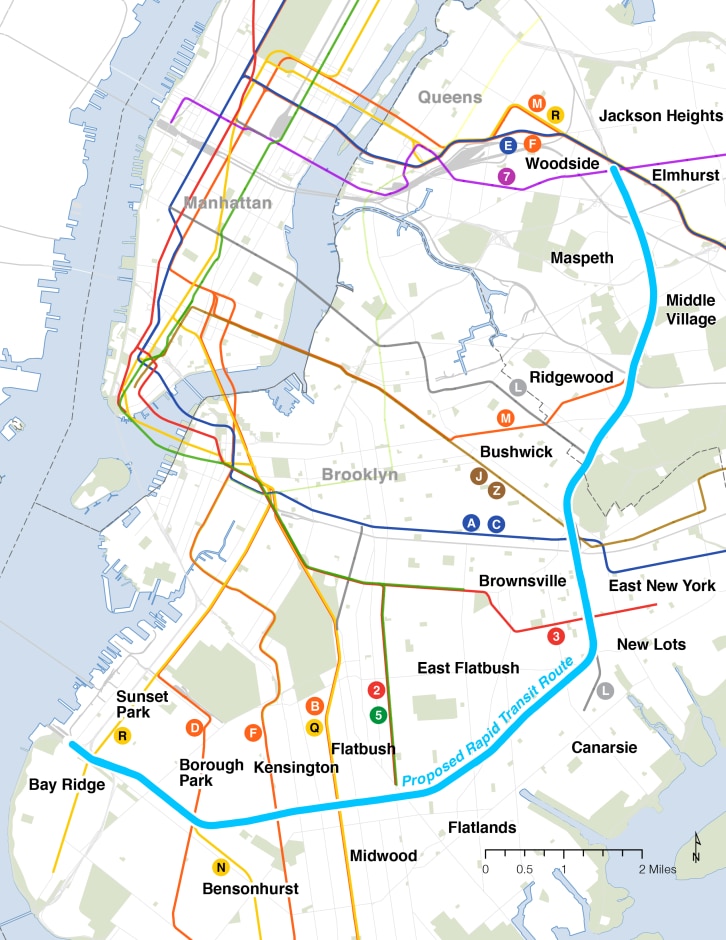
    The project would be built along the existing, LIRR-owned Bay Ridge Branch
    and CSX-owned Fremont Secondary, a 14-mile freight line that extends from Bay
    Ridge, Brooklyn, to Jackson Heights, Queens. It would create a new transit
    option for close to 900,000 residents of the neighborhoods along the route,
    along with 260,000 people who work in Brooklyn and Queens. It would connect
    with up to 17 different subway lines, as well as Long Island Rail Road, with
    end-to-end travel times anticipated at less than 40 minutes. Daily weekday
    ridership is estimated at 115,000.

    Using the existing rail infrastructure means the Interborough Express could
    be built more quickly and efficiently. It would also preserve the Bay Ridge
    Branch’s use as a freight line, providing an opportunity to connect to the
    Port Authority’s Cross-Harbor Freight Project.

    After extensive planning, analysis, and public engagement, Light Rail was
    chosen because it will provide the best service for riders at the best value.
    It also announced a preliminary list of stations and advanced other important
    planning and engineering analysis of the project. The formal environmental
    review process is anticipated to begin soon.

    Project benefits
    - A direct public transit option between Brooklyn and Queens
    - Connections with up to 17 subway lines and Long Island Rail Road
    - A faster commute — end-to-end rides are expected to take 40 minutes
    - A new transit option in underserved locations where more than a third of
    residents are below the federal poverty line
    """,

    task="""As part of the planning processing for IBX, we would like to forecast
     the seasonal foot traffic through a few candidate rail stations with
     connections to subway lines. In each example, forecast the foot traffic
     (number of passengers using the connection) from the source line to
     destination line at the candidate location. Assume the connection and IBX
     have already been open and in use for several months.
    """,

    env=dict(
        CHRONULUS_API_KEY="<YOUR-CHRONULUS-API-KEY>",
    )
)
Describe a prediction input
Here will define the data model that will describe a connection point.
class IBXConnectionPoint(BaseModel):
    candidate_location: str = Field(description="The name of the candidate location for the IBX connection.")
    source_line: str = Field(description="The name of the source line for the foot traffic.")
    destination_line: str = Field(description="The name of the destination line for the foot traffic.")
    project_images: List[ImageFromUrl] = Field(default=[], description="A list of images that provide context for the IBX project.")
    events_schedule: str = Field(description="A schedule of major events in 2025")
Create a Foot Traffic Forecasting Agent
Next, we define a forecasting agent. The agent needs our session context (situation and task) and the description of our inputs.
Get a Forecast for a connection point
To make things interesting, let's get a forecast between the IBX and the 7 Line from August through September. We will also let the agent know when the 2025 US Open is schedule to take place.
# Fill in the metadata for the item or concept you want to predict
connection_point = IBXConnectionPoint(
    candidate_location="74 St - Broadway, with connections to the 7, E, F, M, and R lines",
    source_line="IBX",
    destination_line="F line",
    project_images=[
        ImageFromUrl(url='https://new.mta.info/sites/default/files/inline-images/011022_BRC%20Existing%20Conditions-01_0.png'),
        ImageFromUrl(url='https://files.mta.info/s3fs-public/2023-12/ibxhero.png'),
    ],
    events_schedule="""
        - US Open: Mon, Aug 25, 2025 – Sun, Sep 7, 2025
    """
)
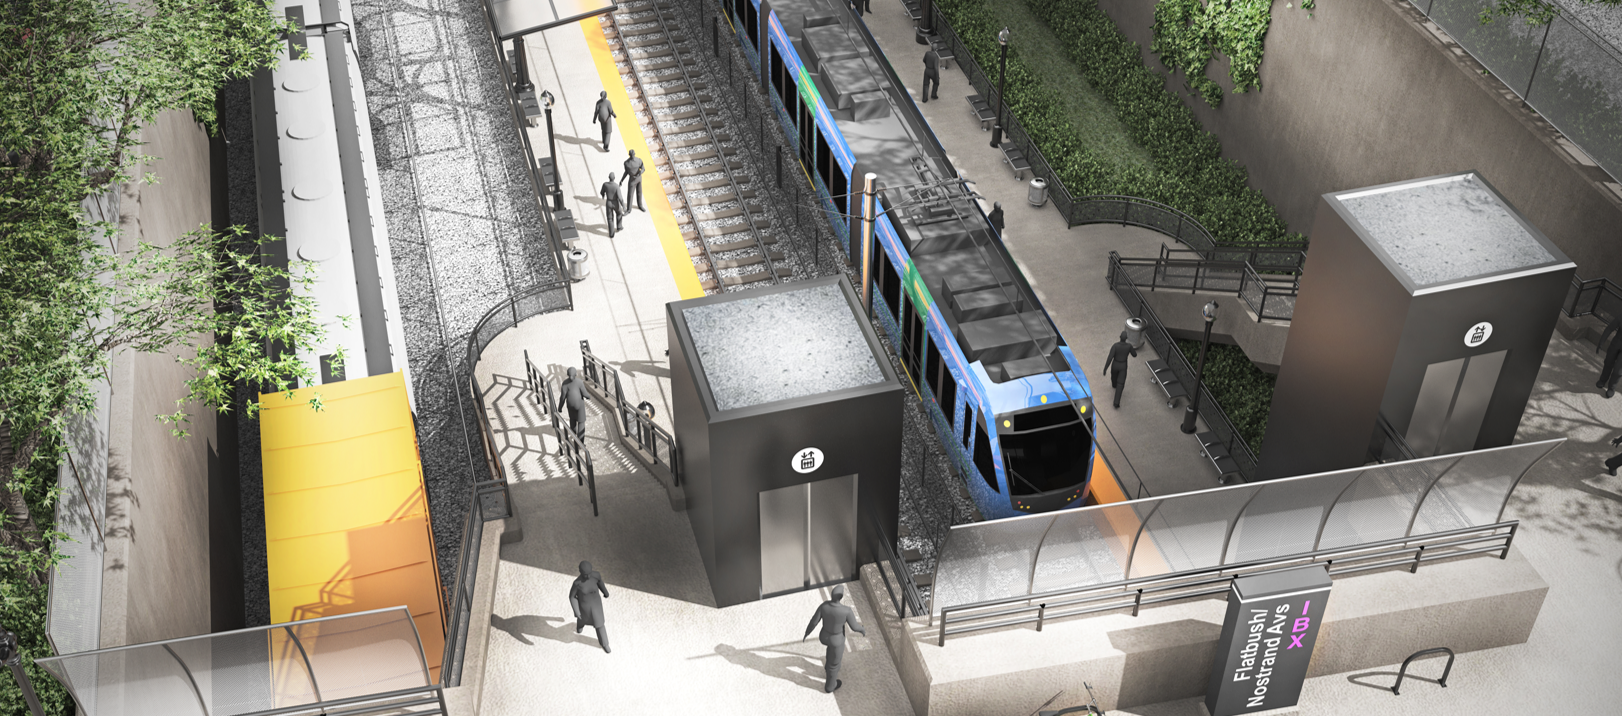
These are the images that we included from the MTA project page:


Forecast Daily foot traffic between the 7 Line and IBX
forecast_start_date = datetime(2025, 8, 1)
req = nf_agent.queue(connection_point, start_dt=forecast_start_date, days=60, note_length=(7, 10))
predictions = nf_agent.get_predictions(req.request_id)
> predictions[0].to_pandas()

            y_hat
date
2025-08-01  0.632371
2025-08-02  0.482215
2025-08-03  0.452515
2025-08-04  0.651231
2025-08-05  0.649705
... ...
2025-09-25  0.682126
2025-09-26  0.691100
2025-09-27  0.514446
2025-09-28  0.491080
2025-09-29  0.686795

Explanation for daily predictions
The 74th St-Broadway connection point represents a major transit hub in Queens where the IBX will intersect with multiple subway lines. The 7 line to IBX transfer predictions factor in several key considerations. First, the 7 line serves a dense residential corridor with high commuter traffic, particularly during weekday rush hours. The US Open tournament (Aug 25-Sep 7) will significantly boost ridership due to the station's proximity to the USTA Tennis Center, with peaks during match sessions. Weekend ridership typically drops by 30-40% compared to weekdays, but maintains steady flows due to recreational travelers and weekend workers. Late August sees slightly lower baseline ridership due to vacation season, with a gradual increase in September as schools reopen and regular commuting patterns resume. Early morning and late evening hours show reduced transfer volumes, with peak transfers occurring during the 8-10 AM and 4-7 PM windows. The predictions also account for typical weather patterns in late summer that can affect surface-level light rail operations.
Forecast Hourly foot traffic between the 7 Line and IBX
Since our situation and task do not reference our time scale, we can simply reuse the same agent to predict the hour foot traffic. Let zoom in on the final 5 days of the US Open.
forecast_start_date = datetime(2025, 9, 4)
req = nf_agent.queue(connection_point, start_dt=forecast_start_date, hours=5*24, note_length=(7, 10))
predictions = nf_agent.get_predictions(req.request_id)

Explanation for hourly predictions
The 74 St-Broadway station is a major transit hub in Queens that will see significant transfer activity between the 7 line and IBX. For this prediction period during the US Open (September 4-8, 2025), I'm considering several key factors. The 7 line traditionally sees heightened ridership during the US Open due to its connection to the USTA Tennis Center. Morning rush hours (6-10 AM) will see moderate transfer volumes as commuters use the IBX for cross-borough travel. Peak transfer activity will occur during evening rush hours (4-8 PM), amplified by US Open attendees returning from matches. Weekend patterns will show more distributed ridership throughout the day, with peaks around mid-day when tennis matches are in full swing. Late night ridership drops significantly after the last US Open matches conclude. The prediction also accounts for typical weather patterns in early September and the station's location in a dense residential and commercial area. The overall transfer patterns reflect both regular commuter behavior and the special event impact of the US Open.